How to Track QR Code Scans and Get Valuable Statistics
To create QR code for link, video or image - click on button below.

.png)

QR codes have successfully entered the modern rhythm of life. Their functionality draws the attention of users and representatives of different business segments. Each of the parties greatly benefits from QR technology: ordinary people value QR codes for their convenience and utility, while startups and established companies derive strategic advantages from QR codes.
It’s not just about the ability to create a QR code online. Also you can track how many times a QR code is scanned. You would probably agree that in the current realities, this is a vital condition for the activity and existence of many companies. Since before you can make improvements you need to rate how well your business works.
In this article we will understand together what trackable QR code means, what advantages the QR tracking statistics gives and how to track QR codes with ME-QR.
What are Trackable QR Codes?
A trackable QR code is a type of QR that is designed to provide detailed analytics about user interactions. Unlike standard QR codes, trackable QR incorporates tracking parameters, such as UTM (Urchin Tracking Module) parameters, within their URLs. These parameters allow marketers and businesses to monitor various aspects of how the QR codes are being used.
When it is scanned, the embedded URL containing the tracking parameters is triggered, sending specific information back to the analytics platform. This information can include the source of the scan (e.g., a flyer, a poster, or a product packaging), the medium (e.g., print, digital), and the campaign name. These details help businesses to understand which marketing efforts are most effective.
The importance of QR code tracking
QR codes have significantly revamped traditional marketing. They allow you to analyze the behavior of the target audience and draw conclusions about the effectiveness of advertising campaigns, reasonability of costs spent on marketing, and optimization of marketing methods and techniques. As a result, you’ll be able to define and expand your audience, improve customer engagement, increase ROI, and achieve your business goals.
To get valuable statistics, you need to generate the QR code of a dynamic type. Unfortunately, you can’t track static QR codes, and they can’t be changed once generated. Therefore, in most cases, the choice falls on a dynamic code.
So, the most important statistical indicators of a QR code include:

Data of scans in real time (you can optionally filter information by day, week, month, year);

Information about the devices your users are using (for example, based on iOS or Android);

Geography of scans (in the form of a map).
Using the ME-QR generator, you’ll have access to the detailed statistics: the total and a unique number of scans, the average number of scannings per day, and potential earnings under the ME-CITY program, etc. This data is saved in your dashboard and is available to you 24/7.

How to Create a Trackable QR Code

Before you start gathering detailed statistics on generated QR codes, you need to choose a reliable QR code generator with tracking. Try to create, manage, and track your QR codes with ME-QR. All our QR codes are dynamic, which means you can edit their URL, update the design, change the content type, and get informative statistics.
Our service provides all this data in real-time. Thus, you’ll receive detailed QR code statistics with just a few clicks. Analytics is constantly updated, which means you’ll have the most up-to-the-minute report.
To create the QR code to further track its statistics, you need to:
- Open the ME-QR generator and be sure to register so that all created QR codes are saved in your dashboard;
- Select the QR code type from the list of available ones (it can be text, an audio file of any format, business card, etc.).
- Select the desired category of the QR-content from the list of available ones (of your choice);
- Add the necessary information (there may be required and optional fields depending on the selected type of the QR code);
- Click the 'Generate QR Code' button.


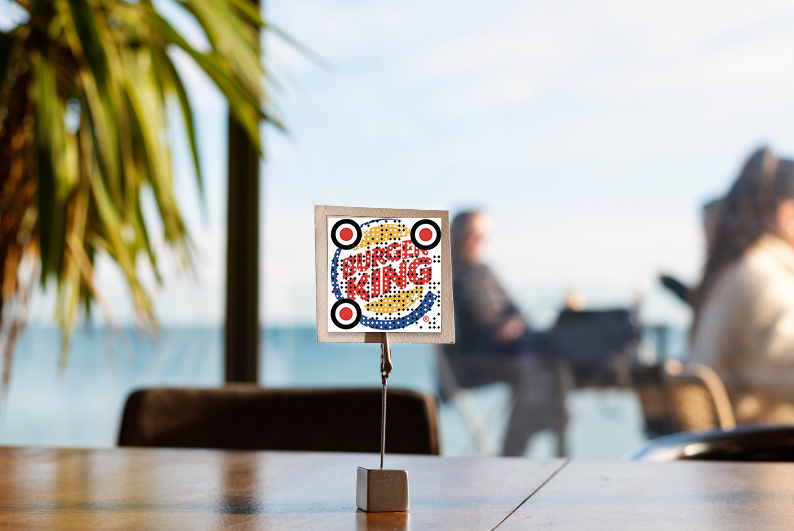
If you want to make the QR code with a link more attention-getting, then customize its design. Choose a color (for example, make the design to match the corporate identity of your company), choose a frame, add a logo, etc
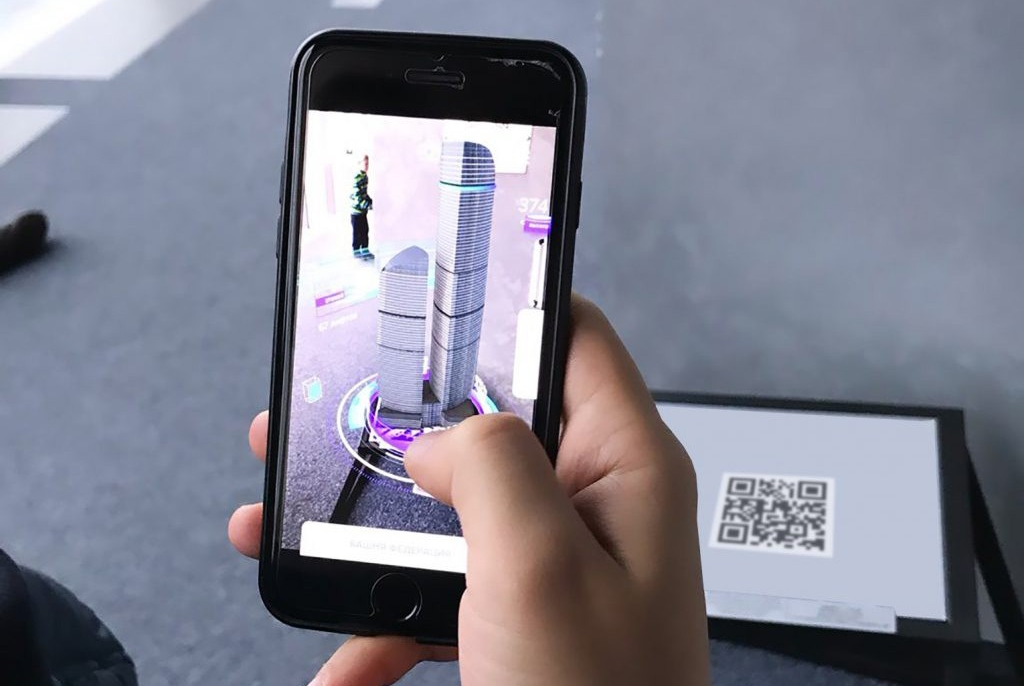
It’s advisable to do a scan test. Make sure your QR code redirects the user to the correct content or link. If you’ve already printed the code but found an error – don’t panic! The content of the dynamic QR can be easily edited without changing the code image itself.
To create a QR code for a link, video or picture - click on the button below.
How to Get QR Code Usage Statistics
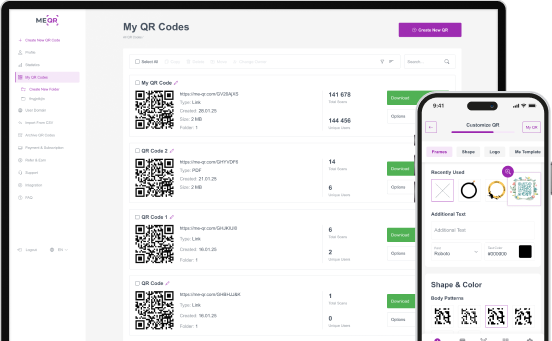
As soon as you have created your first or next QR code, you’ll have full access to it through the ME-QR dashboard. The dashboard is your central hub for managing and analyzing your QR codes.
Within the ME-QR dashboard, you can view detailed statistics about each QR code you’ve created. Here’s what you can expect to find:
- Scan Count. See how many times your QR code has been scanned. This is a basic but essential metric indicating engagement.
- Qr Code Location Tracking. Understand where your scans are coming from by viewing the geographical distribution of users. This data can be displayed on a map for easy visualization.
- Time-based Trends. Track when your QR code is being scanned the most. This can help you identify peak engagement times and plan your campaigns accordingly.
- Device and OS Information. Discover what devices (smartphones, tablets, etc.) and operating systems (iOS, Android, etc.) are being used to scan your QR code.
- Referral Information. See which sources or channels are leading to the most scans. This could include social media, email campaigns, or print materials.
By regularly monitoring and analyzing the statistics available through the ME-QR dashboard, you can make informed decisions that enhance the effectiveness of your QR code campaigns, ultimately leading to better engagement and higher conversion rates.
How to Track QR Code in Google Analytics
Tracking QR codes with Google Analytics can be a game-changer for businesses looking to measure the effectiveness of their offline marketing efforts. By integrating a QR generator with analytics, you can gain valuable insights into user behavior and campaign performance.
First, you'll need a QR generator that links to Google Analytics. This allows you to create QR codes embedded with UTM parameters. These parameters will help you track scans in Google Analytics by tagging the URLs with specific campaign details such as source, medium, and campaign name. For instance, you can generate a URL like this: https://yourwebsite.com/?utm_source=qr_code&utm_medium=offline&utm_campaign=summer_sale.
Once your QR code is ready, you can use Google Analytics to monitor the traffic. You’ll see detailed reports showing how many users scanned your QR codes, their geographical location, devices used, and more. This setup not only helps in understanding the impact of your campaigns but also in optimizing future marketing strategies based on real data.
By leveraging a QR code generator with analytics, you can seamlessly integrate your offline marketing efforts with digital analytics, offering a comprehensive view of your campaign’s reach and effectiveness.
Start Tracking QR Code Scans with ME-QR
Using QR code analytics, businesses can gain valuable insights into user behavior. For those wondering how to track QR code scans or can you track QR code scans, the answer is a resounding yes.
With the help of a QR codes tracking app, you can monitor and analyze QR code scan data, allowing you to enhance user experiences and improve the efficiency of your processes. Stay updated with trends and leverage trackable QR codes to maximize your business potential.
Now feel free to use our ME-QR generator! From now on, you know how to track QR code scans statistics and analyze the data obtained.
